Decoding Customer Behavior: Advanced Heatmap and Session Recording Tools for a 35% Better UX in 2026
Decoding Customer Behavior: Advanced Heatmap and Session Recording Tools for a 35% Better UX in 2026
In the fiercely competitive digital landscape of today, understanding your users isn’t just an advantage; it’s a necessity for survival and growth. Businesses are constantly seeking innovative ways to enhance user experience (UX), and rightly so. A superior UX translates directly into higher engagement, increased conversions, and ultimately, greater profitability. By 2026, the expectation is that companies leveraging advanced analytics will achieve a staggering 35% improvement in UX. This isn’t a pipe dream; it’s an achievable goal, powered by sophisticated tools like heatmaps and session recordings that offer unparalleled insights into customer behavior analysis.
Gone are the days of relying solely on quantitative data like page views and bounce rates. While valuable, these metrics only tell part of the story. They tell you what happened, but rarely why. To truly optimize UX, you need to delve deeper, observing how users interact with your website or application in real-time. This is where advanced heatmap and session recording tools become indispensable. They provide a qualitative layer of data, revealing the nuances of user interaction, identifying pain points, and uncovering opportunities for improvement that traditional analytics simply cannot.
This comprehensive guide will explore how these powerful tools can transform your understanding of customer behavior analysis, enabling you to make data-driven decisions that lead to a significantly better user experience. We’ll delve into the mechanics of heatmaps and session recordings, discuss their various applications, and outline a strategic roadmap to leverage them for a projected 35% UX improvement by 2026. Prepare to unlock the secrets hidden within your user interactions and revolutionize your digital strategy.
The Core of Understanding: What is Customer Behavior Analysis?
Before we dive into the tools, let’s establish a clear understanding of customer behavior analysis. At its heart, it’s the process of examining how customers interact with a business, its products, and its services. In the digital realm, this translates to understanding how users navigate a website, what content they engage with, where they click, how long they stay on a page, and ultimately, what drives their decisions to convert or leave. It’s about more than just numbers; it’s about understanding the human element behind the clicks and scrolls.
Traditional analytics tools provide aggregate data. They might tell you that 70% of users drop off on a particular page. While this is useful, it doesn’t explain why they drop off. Is the content confusing? Is a call-to-action (CTA) missing or poorly placed? Is there a technical glitch? This is the void that advanced tools fill, offering a granular view of individual and collective user journeys.
Effective customer behavior analysis aims to:
- Identify user needs and preferences: What are users looking for? What do they value most?
- Uncover pain points and frustrations: Where do users struggle or get stuck?
- Optimize conversion funnels: How can we make it easier for users to achieve their goals (e.g., purchase, sign-up)?
- Personalize user experiences: How can we tailor content and functionality to individual user segments?
- Improve overall website/app usability: Is the interface intuitive and easy to navigate?
By answering these questions, businesses can move beyond assumptions and make informed decisions that resonate with their target audience, leading to a more satisfying and efficient user experience. This deep dive into user psychology and interaction patterns is the foundation for achieving significant UX improvements.
Heatmaps: Visualizing User Attention and Interaction
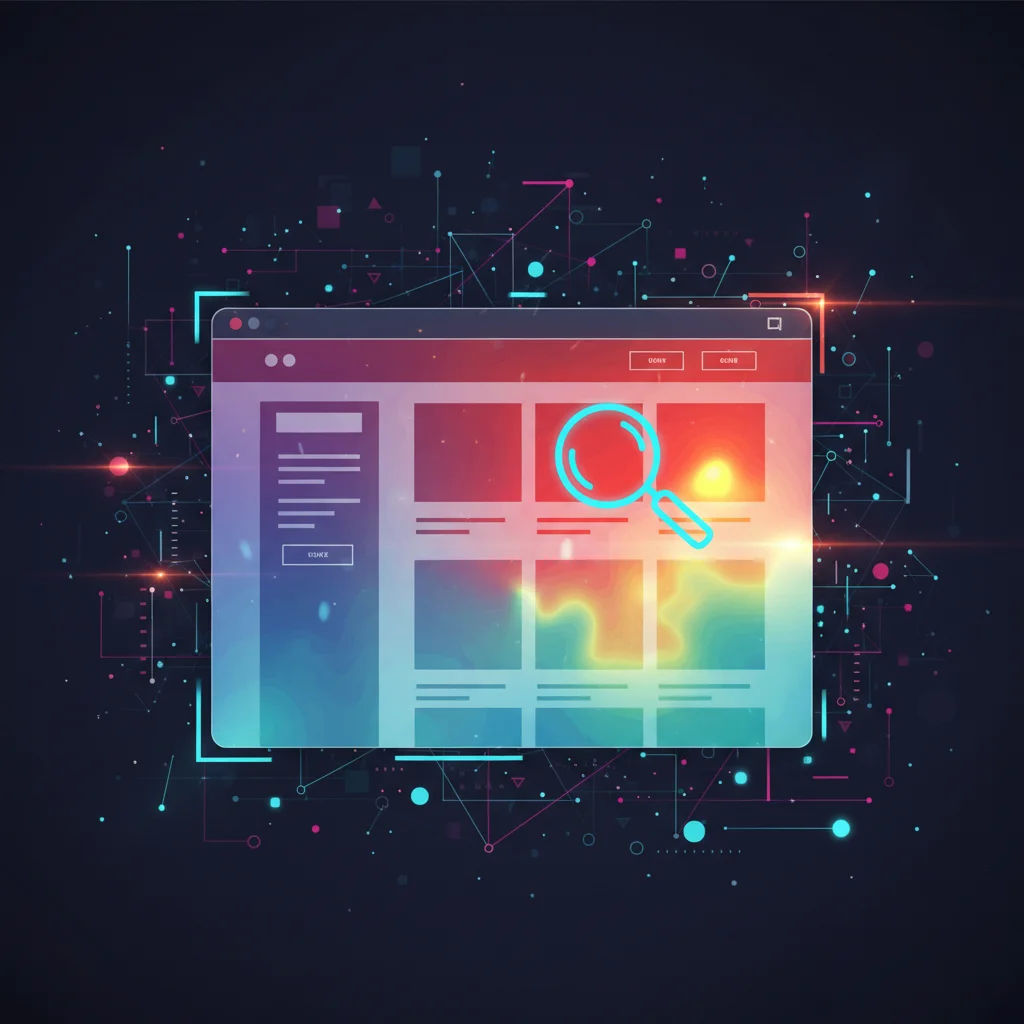
Heatmaps are perhaps the most visually intuitive tool for customer behavior analysis. They represent user activity on a webpage using a color-coded system, similar to a weather map. Areas of high interaction (clicks, scrolls, mouse movements) are typically displayed in ‘hot’ colors like red and orange, while areas of low interaction appear in ‘cool’ colors like blue and green.
Types of Heatmaps and Their Applications:
- Click Maps: These show exactly where users click on a page. They are invaluable for understanding which elements attract attention, identifying ignored CTAs, or even discovering ‘rage clicks’ on non-clickable elements, indicating user frustration. For instance, if users are repeatedly clicking on an image that isn’t a link, it suggests they expect it to be interactive.
- Scroll Maps: Scroll maps reveal how far down a page users scroll. This helps determine if important content or CTAs are placed ‘below the fold’ (i.e., not visible without scrolling), leading to decreased engagement. If a significant portion of your audience isn’t seeing key information, you have a clear area for optimization.
- Move Maps (or Hover Maps): These track where users move their mouse cursors, even if they don’t click. The ‘gaze-cueing’ phenomenon suggests that mouse movement often mirrors eye movement, offering insights into what users are looking at. This can highlight areas of interest, even on pages with minimal clickable elements.
- Attention Maps: Combining data from click, scroll, and move maps, attention maps provide a comprehensive view of which areas of a page capture the most user attention over time. This is excellent for evaluating content effectiveness and visual hierarchy.
The power of heatmaps lies in their ability to quickly reveal patterns and anomalies in user interaction. Instead of sifting through rows of numbers, you get an instant visual representation of where your users are focusing their energy. This makes them an excellent starting point for any UX optimization initiative, guiding you towards areas that require further investigation.
Session Recordings: The ‘DVR’ for User Journeys
While heatmaps offer an aggregated view, session recordings provide the ultimate qualitative data for customer behavior analysis. Imagine a digital video recorder (DVR) for your website: session recordings capture and replay individual user sessions, showing every mouse movement, click, scroll, form fill, and even rage click. This allows you to literally see your website through your users’ eyes, offering an unparalleled level of insight into their experience.
Key Benefits of Session Recordings:
- Identifying Usability Issues: Watch users struggle with navigation, encounter broken elements, or get confused by unclear instructions. These recordings highlight friction points that might be invisible through other analytics.
- Understanding User Intent: By observing a user’s journey, you can infer their goals and motivations. Are they searching for specific information? Are they comparing products? This insight is crucial for tailoring your content and offerings.
- Debugging Technical Glitches: Sometimes, users encounter bugs or errors that go unreported. Session recordings can visually confirm these issues, providing developers with concrete evidence and replication steps.
- Optimizing Conversion Funnels: Follow users through your checkout process or sign-up forms. Where do they hesitate? Which fields cause confusion? This granular view helps streamline critical conversion paths.
- Empathizing with Users: There’s no substitute for seeing a user’s genuine experience. Session recordings foster empathy, allowing you to truly understand their frustrations and triumphs, leading to more human-centered design decisions.
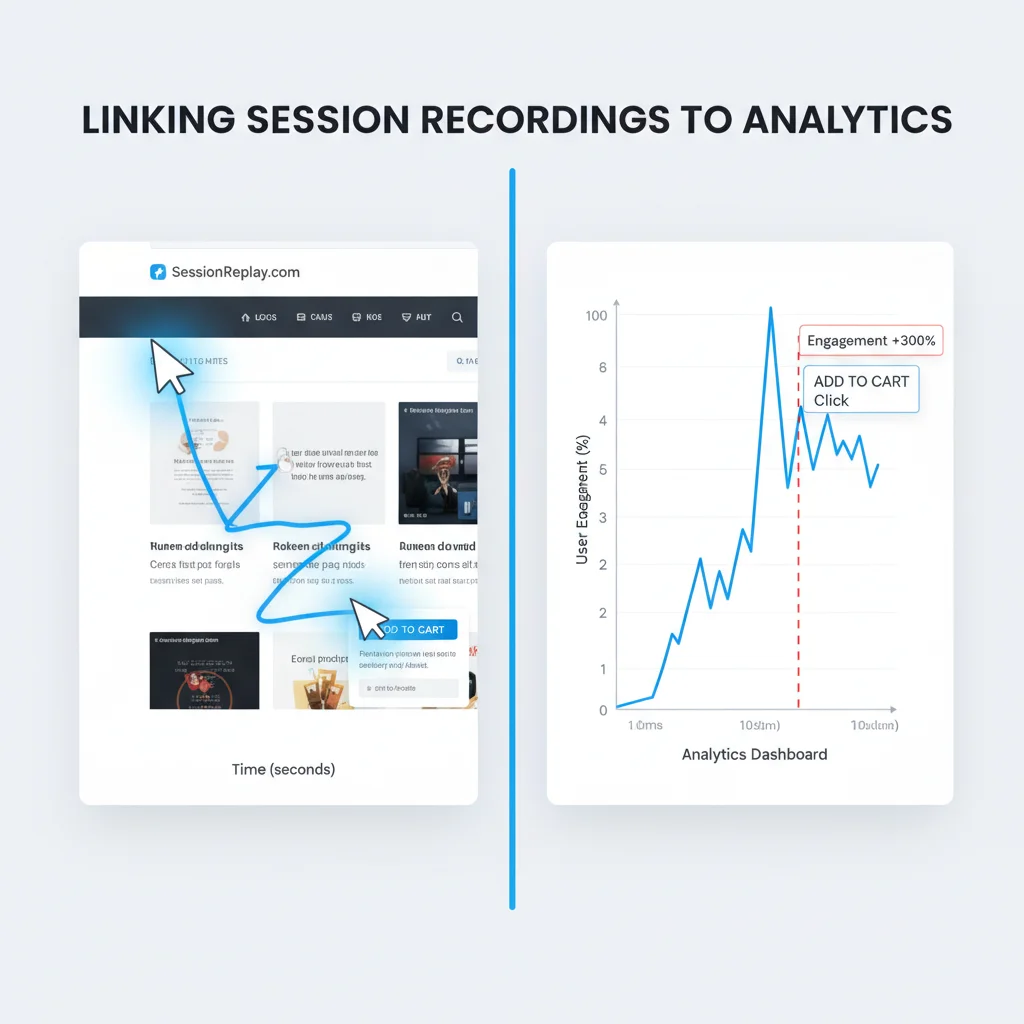
Combining heatmaps with session recordings creates a formidable duo for customer behavior analysis. Heatmaps pinpoint problem areas, and session recordings provide the ‘why’ behind those problems, showing the exact moments of user struggle or delight.
Integrating Heatmaps and Session Recordings for a Holistic View
The true power of these tools emerges when they are used in conjunction. Think of it as a two-pronged approach to customer behavior analysis:
- Heatmaps First: Start by analyzing heatmaps to identify macro-level trends and potential problem areas. For example, a click map might show that a crucial CTA button is being ignored, or a scroll map might reveal that users aren’t reaching the bottom half of a long product page.
- Session Recordings Second: Once you’ve identified these areas, dive into session recordings of users who interacted with (or failed to interact with) those specific elements. Watch multiple sessions to observe patterns. Did users hesitate before clicking? Did they try to click on something non-interactive? Did they abandon the page after encountering a specific section?
This iterative process allows you to quickly pinpoint issues and then gain a deep qualitative understanding of their root causes. For instance, a heatmap might show low engagement on a product description. You then watch session recordings and discover that users are consistently getting stuck on a complex jargon-filled paragraph, or they’re unable to find the ‘add to cart’ button because it’s hidden by a pop-up. Without both tools, you might only know there’s a problem, but not how to fix it.
Practical Scenarios:
- E-commerce Checkout Optimization: A scroll map might show that many users don’t see the ‘apply discount code’ field. Session recordings could then reveal that users are getting confused by the placement or the wording of the field, leading to abandoned carts.
- Content Engagement: A move map might indicate that users are hovering over specific images or text blocks more than others. Session recordings can then confirm if this translates into deeper engagement or if users are struggling to find associated information.
- Form Optimization: Heatmaps on forms can show which fields are skipped or cause hesitation. Session recordings can then illustrate users’ frustration as they repeatedly try to enter data in the wrong format or struggle with unclear error messages.
By systematically applying both heatmaps and session recordings, businesses gain an unparalleled understanding of customer behavior analysis, paving the way for targeted and effective UX improvements.
Strategic Roadmap for a 35% UX Improvement by 2026
Achieving a 35% improvement in UX by 2026 requires a structured, continuous optimization strategy. Here’s a roadmap outlining how to leverage heatmaps and session recordings for maximum impact:
Phase 1: Foundation and Initial Data Collection (Months 1-3)
- Tool Selection and Implementation: Choose robust heatmap and session recording tools that integrate well with your existing analytics platform (e.g., Google Analytics). Ensure proper installation and data collection across all critical pages.
- Define Key Performance Indicators (KPIs): Establish clear UX-related KPIs to track progress. These might include conversion rates, bounce rates, task completion rates, time on page for key content, or customer satisfaction scores.
- Baseline Measurement: Collect initial data to establish a baseline for your current UX performance. This will be crucial for measuring the impact of your future optimizations.
- Initial Hypothesis Generation: Based on your current understanding of your users, formulate initial hypotheses about potential UX issues and areas for improvement.
Phase 2: Deep Dive into Customer Behavior Analysis (Months 4-12)
- Systematic Heatmap Analysis: Regularly review click, scroll, and move maps for all critical pages (landing pages, product pages, checkout flows, contact forms). Look for patterns of high and low engagement, ignored elements, and areas of confusion.
- Targeted Session Recording Review: For each identified anomaly or potential pain point from heatmaps, watch a significant number of relevant session recordings. Focus on segments of users (e.g., users who abandoned a cart, new visitors vs. returning visitors).
- Identify and Prioritize UX Issues: Compile a list of all identified UX issues, categorizing them by severity and potential impact on your KPIs. Prioritize issues that have the highest potential for improvement with the least effort.
- Root Cause Analysis: For each prioritized issue, use session recordings to conduct a thorough root cause analysis. Is it a design flaw, unclear copy, a technical bug, or something else?
Phase 3: Iterative Optimization and Testing (Months 13-24)
- Formulate Solutions: Based on your customer behavior analysis, brainstorm and design specific solutions for each identified UX issue. This could involve redesigning a section, rewriting copy, improving navigation, or fixing a technical bug.
- A/B Testing: Implement your solutions through A/B testing. This allows you to compare the performance of your new design/feature against the original, ensuring that your changes genuinely lead to improvement.
- Monitor and Analyze Test Results: Carefully monitor the KPIs you defined in Phase 1. Use heatmaps and session recordings on the A/B test variations to understand why one version performs better than another.
- Implement Winning Variations: Roll out the winning variations to your entire audience.
- Continuous Feedback Loop: Establish a continuous feedback loop where new data from heatmaps and session recordings informs subsequent rounds of analysis, hypothesis generation, and testing.
Phase 4: Advanced Personalization and Predictive Analytics (Months 25-36)
- Segment-Specific Analysis: Utilize heatmaps and session recordings to analyze customer behavior analysis for different user segments (e.g., by traffic source, demographic, past purchase history). This allows for highly targeted UX improvements.
- Personalization Strategies: Implement personalization strategies based on your segment-specific insights. Tailor content, product recommendations, and offers to individual user preferences.
- Integrate with AI/ML: Explore integrating your behavior data with AI and machine learning models to predict user behavior and proactively optimize experiences.
- Proactive Issue Detection: Use advanced analytics to identify potential UX issues before they become widespread problems, allowing for proactive intervention.
By diligently following this roadmap, integrating the insights from heatmaps and session recordings into every stage of your UX design and optimization process, you can realistically expect to achieve significant improvements in user satisfaction and conversion rates, reaching that 35% better UX target by 2026.
The Impact of Enhanced UX on Business Growth
A 35% improvement in user experience isn’t just a number; it translates into tangible business benefits. The direct correlation between superior UX and business success is well-documented. Here’s how investing in advanced customer behavior analysis tools and strategies can propel your growth:
- Increased Conversion Rates: When users find your website easy to navigate, understand, and interact with, they are far more likely to complete desired actions, whether that’s making a purchase, filling out a form, or signing up for a newsletter. Optimized UX removes friction, leading to higher conversion rates.
- Reduced Bounce Rates: A frustrating or confusing user experience often leads to users quickly leaving a site. By identifying and resolving these pain points through heatmaps and session recordings, you can significantly reduce bounce rates, keeping users engaged longer.
- Higher Customer Satisfaction and Loyalty: A positive experience fosters goodwill. Satisfied customers are more likely to return, recommend your brand to others, and become loyal advocates. This long-term loyalty is invaluable.
- Improved SEO Rankings: Search engines like Google prioritize websites that offer a good user experience. Factors like low bounce rates, longer time on page, and high engagement signals can positively impact your search engine rankings, driving more organic traffic.
- Decreased Customer Support Costs: When users can easily find information and complete tasks on their own, they are less likely to contact customer support with basic queries or issues. This efficiency translates into cost savings.
- Enhanced Brand Reputation: A seamless and enjoyable digital experience contributes to a positive brand image. In today’s interconnected world, user experience is often a key differentiator.
- Competitive Advantage: Businesses that prioritize and excel in UX often gain a significant edge over competitors who neglect this critical aspect. Being able to quickly adapt and optimize based on deep customer behavior analysis allows for agile responses to market changes.
The financial return on investment (ROI) for UX improvements is substantial. Studies have shown that every dollar invested in UX can yield returns ranging from $2 to $100. This makes the adoption of advanced heatmap and session recording tools not just a best practice, but a strategic imperative for any business aiming for sustained success in the digital age.

Overcoming Challenges in Customer Behavior Analysis
While the benefits are clear, implementing and effectively utilizing these tools for customer behavior analysis comes with its own set of challenges. Awareness and proactive planning can help overcome these hurdles:
- Data Overload: Session recordings, in particular, can generate a vast amount of data. It’s crucial to have a strategy for filtering, segmenting, and prioritizing which sessions to watch. Focusing on specific user segments or sessions that exhibit certain behaviors (e.g., rage clicks, abandonment) can make the process manageable.
- Privacy Concerns (GDPR, CCPA): User privacy is paramount. Ensure your tools are compliant with relevant data protection regulations (like GDPR and CCPA). This often involves anonymizing sensitive data, obtaining explicit consent, and clearly communicating your data collection practices to users.
- Integration with Existing Systems: For a holistic view, your heatmap and session recording data should ideally integrate with other analytics platforms, CRM systems, and marketing automation tools. Choose tools that offer robust API capabilities or pre-built integrations.
- Actionable Insights vs. Raw Data: The goal isn’t just to collect data, but to derive actionable insights. This requires skilled analysts who can interpret patterns, formulate hypotheses, and translate findings into concrete recommendations for design and development teams.
- Organizational Buy-in: Successfully implementing a UX optimization strategy requires buy-in from various stakeholders across the organization, including marketing, product, development, and leadership. Educate teams on the value of customer behavior analysis and its impact on business goals.
- Avoiding Analysis Paralysis: With so much data available, it’s easy to get bogged down in endless analysis. Set clear objectives for each analysis cycle, focus on high-impact areas, and strive for iterative improvements rather than perfection in one go.
By addressing these challenges head-on, businesses can maximize the value derived from their investment in heatmap and session recording tools, transforming raw data into powerful insights that drive a superior user experience.
The Future of Customer Behavior Analysis: AI and Beyond
The landscape of customer behavior analysis is continuously evolving. As we look towards 2026 and beyond, artificial intelligence (AI) and machine learning (ML) are poised to play an even more significant role in how we understand and respond to user interactions.
- Automated Insight Generation: AI algorithms are already capable of sifting through vast amounts of session recording data to automatically identify common user frustrations, patterns of confusion, or areas of high engagement. This significantly reduces the manual effort required for analysis.
- Predictive UX: Imagine a system that can predict potential user issues before they even occur, based on real-time behavior patterns. AI-powered tools could flag anomalies in user journeys, suggesting proactive interventions to prevent abandonment.
- Hyper-Personalization: Leveraging AI, businesses can move beyond segment-based personalization to truly individualize user experiences in real-time, adapting content, navigation, and offers based on immediate user intent and historical behavior.
- Voice and Gesture Analytics: As interfaces evolve beyond traditional clicks and scrolls, future tools will likely incorporate advanced analytics for voice commands, gesture interactions, and even emotional responses, providing an even richer understanding of user sentiment and experience.
- Virtual Reality (VR) and Augmented Reality (AR) UX: With the rise of immersive technologies, customer behavior analysis will extend to understanding interactions within VR and AR environments, posing new challenges and opportunities for optimization.
The journey to a 35% better UX by 2026 is not just about adopting current best practices; it’s about embracing the future. Businesses that stay ahead of these technological advancements and integrate them into their customer behavior analysis strategies will be the ones that truly dominate the digital experience landscape.
Conclusion: Empowering Your UX with Data-Driven Insights
The pursuit of an exceptional user experience is a continuous journey, not a destination. In the digital age, where user expectations are constantly rising, relying on guesswork or outdated metrics is no longer an option. Advanced heatmap and session recording tools offer an indispensable window into the intricate world of customer behavior analysis, providing the qualitative data needed to truly understand your users’ needs, frustrations, and desires.
By systematically integrating these tools into your UX optimization strategy, following a structured roadmap of analysis, testing, and iteration, you can move beyond assumptions and make data-driven decisions that resonate deeply with your audience. The projected 35% improvement in UX by 2026 is an ambitious yet achievable goal, one that promises not only enhanced user satisfaction but also significant gains in conversion rates, customer loyalty, and overall business growth.
Embrace the power of visual insights and recorded journeys. Let your users’ actions guide your improvements. The future of digital success belongs to those who truly understand their customers, and with heatmaps and session recordings, that understanding is more accessible and actionable than ever before. Start decoding your customer behavior analysis today, and pave the way for a more intuitive, engaging, and successful digital experience tomorrow.