Sales Enablement Metrics: Boost Win Rates 30% by Q4 2026
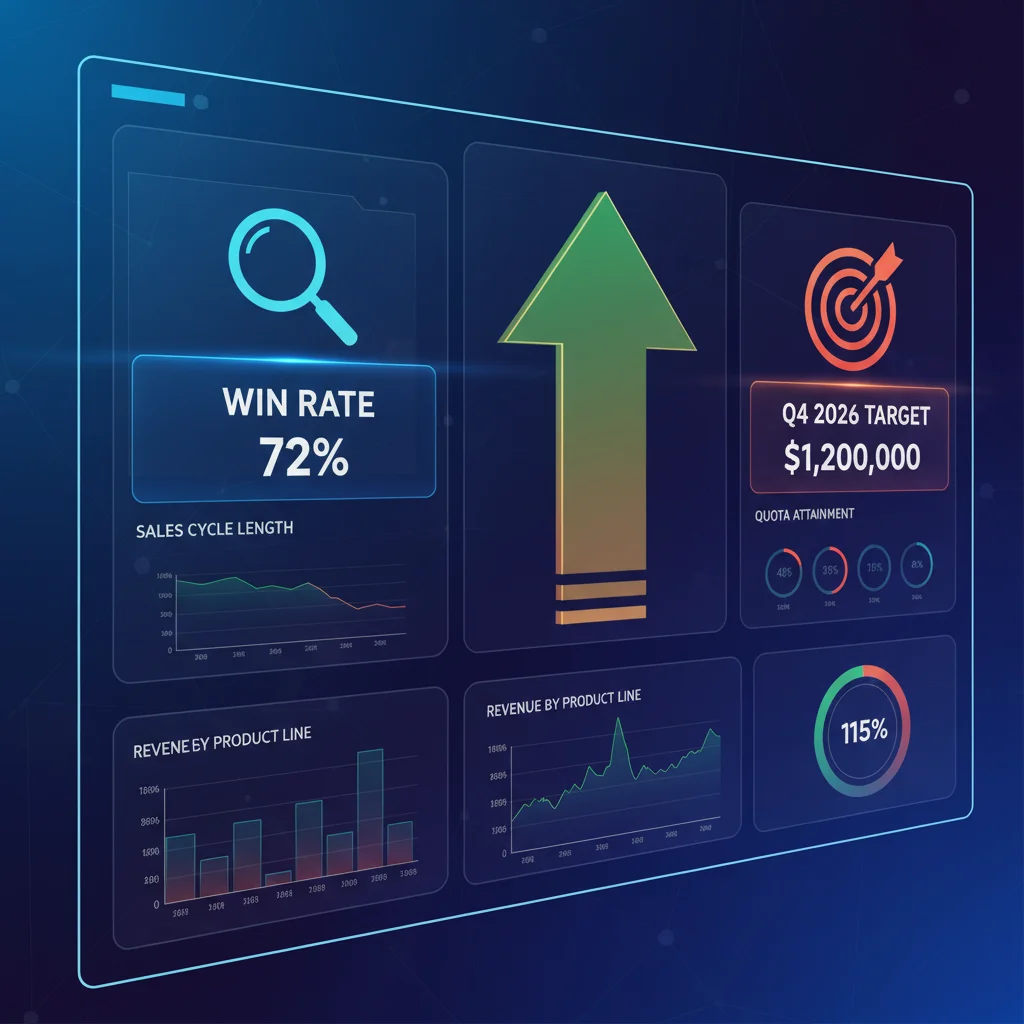
In today’s fiercely competitive business landscape, achieving significant growth isn’t just about having a great product or service; it’s about empowering your sales team with the right tools, knowledge, and strategies to convert prospects into loyal customers. This is where sales enablement metrics become indispensable. For organizations aiming for ambitious goals, such as a 30% boost in win rates by Q4 2026, a data-driven approach to sales enablement is not merely beneficial—it’s absolutely critical. Understanding, tracking, and acting upon the correct sales enablement metrics can be the difference between stagnant growth and explosive revenue.
Many businesses invest heavily in sales enablement initiatives, from training programs and content creation to technology stacks, yet struggle to quantify the return on these investments. Without a clear framework for measuring impact, these efforts can feel like shots in the dark. This comprehensive guide will illuminate the most impactful sales enablement metrics, explain how to track them effectively, and demonstrate how a strategic focus on these indicators can lead to a substantial increase in win rates and, consequently, significant financial returns.
Our goal is to equip you with the knowledge to not only understand which metrics matter but also how to leverage them to achieve a targeted 30% increase in win rates by Q4 2026. This isn’t just about tracking numbers; it’s about creating a virtuous cycle of continuous improvement, where data informs strategy, strategy empowers sales, and empowered sales teams deliver superior results.
The Foundation: What Exactly Is Sales Enablement?
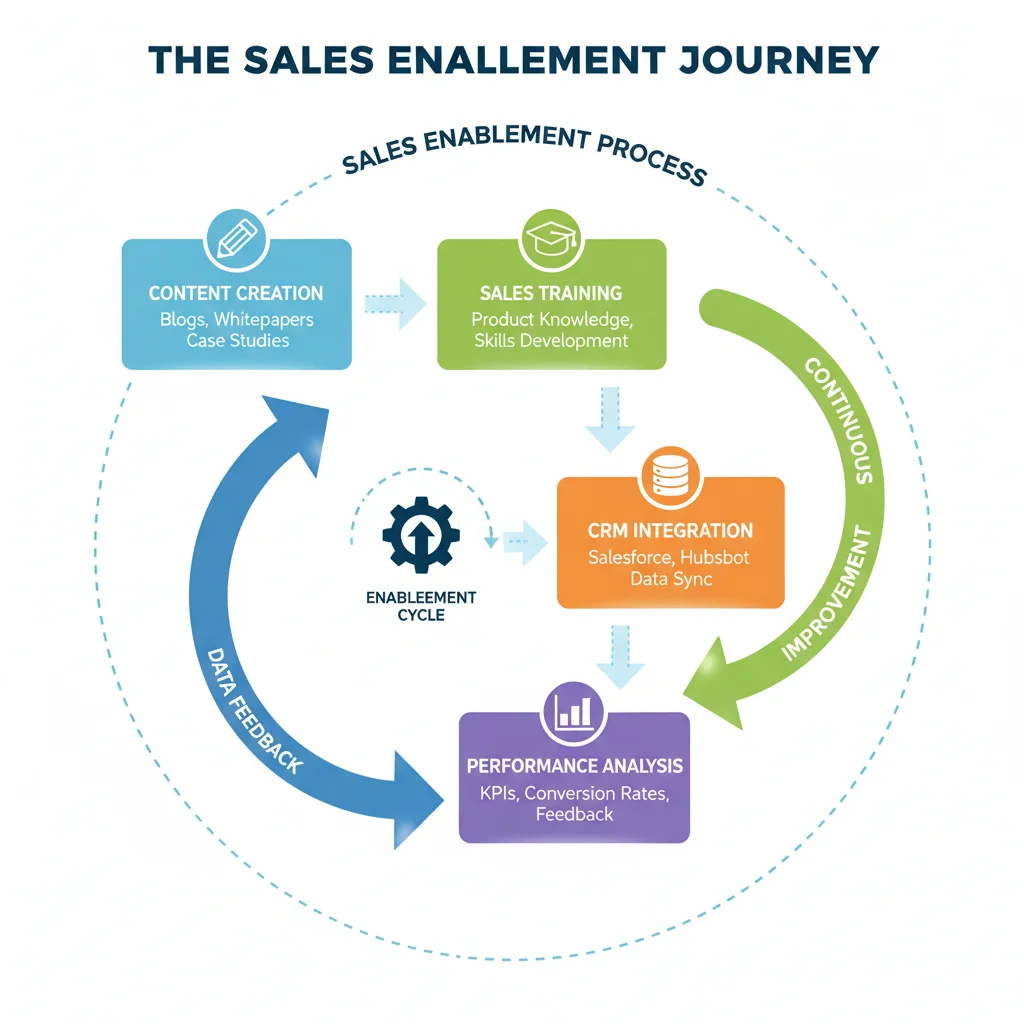
Before diving into the specifics of sales enablement metrics, let’s briefly define sales enablement itself. Sales enablement is the iterative process of providing your sales organization with the resources it needs to sell more effectively. This encompasses a broad range of activities, including:
- Content: Providing sales teams with relevant, high-quality content (presentations, case studies, battle cards, demos) that resonates with buyers at every stage of their journey.
- Training: Equipping sellers with the skills, product knowledge, and market insights necessary to engage prospects confidently and address their pain points.
- Coaching: Offering ongoing, personalized feedback and guidance to improve individual seller performance.
- Technology: Implementing and optimizing tools like CRM, sales engagement platforms, and conversational intelligence software to streamline workflows and enhance effectiveness.
- Process Optimization: Refining sales processes to remove bottlenecks and ensure a smooth, efficient path from lead to close.
The ultimate goal of sales enablement is to improve sales productivity and performance, which directly translates into higher win rates and increased revenue. Without a robust enablement strategy, sales teams often operate inefficiently, leading to missed opportunities and suboptimal results. By understanding this foundational concept, we can better appreciate the role of sales enablement metrics in validating and refining these crucial efforts.
Why Tracking Sales Enablement Metrics is Non-Negotiable for Growth
In an era where every business function is expected to demonstrate ROI, sales enablement is no exception. Tracking sales enablement metrics offers several critical advantages:
- Quantifying ROI: It allows you to demonstrate the tangible value of your enablement initiatives, justifying investment and securing future budget.
- Identifying Strengths and Weaknesses: Metrics provide objective data on what’s working well and where improvements are needed in your enablement programs.
- Driving Continuous Improvement: By regularly analyzing data, you can iterate on your strategies, fine-tune content, refine training, and optimize processes for better outcomes.
- Aligning Sales and Marketing: Shared metrics foster better collaboration and understanding between sales, marketing, and product teams, ensuring everyone is working towards common goals.
- Predictive Analytics: Over time, historical data from sales enablement metrics can help predict future performance and identify potential challenges before they escalate.
Imagine trying to navigate a ship without a compass or a map. That’s what sales enablement without metrics looks like. You might be moving, but you won’t know if you’re heading in the right direction or making progress towards your destination. For our ambitious goal of a 30% win rate boost by Q4 2026, precise navigation through data is paramount.
Key Sales Enablement Metrics That Directly Impact Win Rates
To achieve a 30% increase in win rates, we need to focus on sales enablement metrics that have a direct and measurable impact on a salesperson’s ability to close deals. These metrics can be broadly categorized into performance, efficiency, and effectiveness indicators.
1. Win Rate (The Ultimate Indicator)
Definition: The percentage of opportunities won out of the total opportunities pursued. This is the primary metric we aim to influence.
How Sales Enablement Impacts It: Effective enablement provides salespeople with the right content, training, and tools to articulate value, overcome objections, and differentiate from competitors, all of which directly contribute to higher win rates.
Tracking: Easily tracked within most CRM systems by dividing the number of won deals by the total number of opportunities created in a given period.
Target for Q4 2026: A 30% increase from your current baseline. If your current win rate is 20%, the target would be 26% (20% * 1.30).
2. Sales Cycle Length
Definition: The average time it takes for a salesperson to move a prospect from the initial contact to a closed-won deal.
How Sales Enablement Impacts It: Streamlined content delivery, effective training on discovery and qualification, and efficient sales tools can significantly shorten the sales cycle by enabling reps to move prospects through the funnel more quickly and confidently.
Tracking: Most CRMs can calculate this by averaging the duration of all closed-won deals.
Relationship to Win Rate: Shorter sales cycles often correlate with higher win rates because prospects remain engaged, and fewer opportunities stall or are lost to competitors.
3. Average Deal Size
Definition: The average revenue generated per closed-won deal.
How Sales Enablement Impacts It: Enablement can train reps on effective upselling and cross-selling techniques, value-based selling, and negotiation strategies, leading to larger deals without necessarily increasing the number of opportunities.
Tracking: Calculate the total revenue from won deals divided by the number of won deals.
Financial Impact: Increasing average deal size while maintaining or improving win rates has a direct and powerful financial impact.
4. Sales Content Utilization and Effectiveness
Definition: Measures how frequently sales teams use enablement content (e.g., case studies, product sheets, presentations) and how effective that content is in advancing deals.
How Sales Enablement Impacts It: A robust content strategy ensures reps have access to relevant, high-quality materials at the right time. Tracking usage helps identify popular and effective content, as well as gaps.
Tracking: Requires content management systems or sales enablement platforms that can track content views, shares, and engagement (e.g., prospect opens, time spent). Correlate content usage with deal progression and win rates.
Example: If deals where specific ROI calculators are used have a 15% higher win rate, that calculator is highly effective enablement content.
5. Sales Training Completion and Application Rates
Definition: The percentage of sales reps completing assigned training modules and, more critically, how well they apply that training in real-world selling scenarios.
How Sales Enablement Impacts It: Well-designed training programs should lead to measurable improvements in skills and knowledge, which in turn affect sales performance.
Tracking: Completion rates are straightforward via LMS platforms. Application rates are harder but can be assessed through call recordings analysis (conversational intelligence), role-playing feedback, manager observations, and correlating training completion with individual sales performance metrics (e.g., win rates of trained vs. untrained reps).
6. Sales Rep Ramp-Up Time
Definition: The time it takes for a new sales representative to become fully productive (e.g., hit their quota consistently).
How Sales Enablement Impacts It: Efficient onboarding and continuous enablement reduce the time it takes for new hires to contribute meaningfully, directly impacting overall team productivity and revenue generation.
Tracking: Measure the time from a new hire’s start date until they consistently meet a predefined performance benchmark (e.g., 70% of quota for three consecutive months).
7. Quota Attainment
Definition: The percentage of salespeople who achieve or exceed their assigned sales quota.
How Sales Enablement Impacts It: While a broader sales metric, effective enablement is a primary driver of higher quota attainment. By providing reps with the necessary resources and skills, enablement directly supports their ability to hit targets.
Tracking: Tracked on an individual and team basis, often within CRM or sales performance management systems.
8. Customer Lifetime Value (CLV)
Definition: The total revenue a business can reasonably expect to earn from a single customer account over the duration of their relationship.
How Sales Enablement Impacts It: Enablement can train reps to identify and sell to ideal customer profiles, set proper expectations, and focus on building long-term relationships, leading to higher customer satisfaction and retention, thus increasing CLV.
Tracking: Requires collaboration with customer success and finance teams. Calculate average revenue per customer over their lifespan.
Establishing Your Baseline and Setting Realistic Targets
Before you can aim for a 30% boost in win rates by Q4 2026, you must know your current starting point. This means establishing a clear baseline for your current win rate and other relevant sales enablement metrics.
- Gather Historical Data: Look at your CRM data for the past 12-24 months to understand your average win rate, sales cycle length, and average deal size.
- Segment Your Data: Analyze metrics by sales team, product line, region, or even individual rep. This can reveal specific areas needing enablement support.
- Define Your Target: If your current win rate is 20%, a 30% increase means a target of 26%. Break this down quarterly or bi-annually to create manageable milestones. For example, aiming for a 5-6% increase each year over two years might be more achievable than a single leap.
- Communicate Clearly: Ensure your sales team and enablement team understand the goals, why they are important, and how their efforts contribute to achieving them.
Setting realistic yet ambitious targets is crucial. A 30% increase in win rates is significant and will require concerted effort across multiple enablement fronts.
Strategies for Leveraging Sales Enablement Metrics to Achieve Your Goal
Tracking metrics is only half the battle; the real value comes from leveraging that data to inform and optimize your sales enablement strategy.
1. Data-Driven Content Strategy
- Identify Content Gaps: If you notice low utilization of certain content types or if deals stall at specific stages, it might indicate a need for new or improved content (e.g., competitor battle cards, ROI calculators, industry-specific case studies).
- Optimize Existing Content: Analyze which content pieces correlate with higher win rates or shorter sales cycles. Promote these, and refine or retire underperforming assets.
- Personalization: Enable reps to easily find and personalize content for specific buyer personas and industries, improving relevance and impact.
2. Targeted Training and Coaching
- Pinpoint Skill Gaps: If individual reps or teams have lower win rates, dive into their specific sales enablement metrics. Is it discovery? Objection handling? Negotiation? Tailor training to these specific areas.
- Reinforce Key Learnings: Use call recordings and coaching sessions to ensure reps are applying new skills learned in training. For instance, if training focused on value-based selling, review calls to see if reps are effectively articulating value over features.
- Peer Learning: Identify top performers based on metrics and facilitate knowledge sharing sessions where they can share best practices with the rest of the team.
3. Technology Optimization
- CRM Hygiene: Ensure your CRM is being used effectively to track opportunities, stages, and outcomes. Accurate data is the bedrock of reliable metrics.
- Leverage Sales Engagement Platforms: Utilize tools that automate outreach, track prospect engagement with content, and provide insights into which messages resonate most.
- Conversational Intelligence: Implement tools that analyze sales calls for keywords, sentiment, and talk-to-listen ratios. This provides invaluable insights into rep performance and buyer behavior, directly impacting win rates.

4. Aligning Sales and Marketing
- Shared Definitions: Ensure sales and marketing agree on what constitutes a qualified lead and how opportunities are defined in the CRM.
- Feedback Loops: Establish formal processes for sales to provide feedback to marketing on content effectiveness, lead quality, and market insights. This ensures marketing creates highly impactful enablement materials.
- Joint Analysis: Regularly review sales enablement metrics together to identify areas for improvement in lead handoff, content usage, and overall messaging consistency.
Measuring Financial Impact: Beyond Just Win Rates
While a 30% boost in win rates by Q4 2026 is an ambitious and impactful goal, it’s crucial to connect this improvement directly to financial outcomes. A higher win rate doesn’t just look good on a report; it directly contributes to:
- Increased Revenue: More closed deals mean more money in the bank. Quantify this by projecting the additional revenue generated from the increased win rate.
- Improved Profit Margins: If enablement helps reps sell value over price, it can lead to fewer discounts and better profit margins per deal.
- Reduced Customer Acquisition Cost (CAC): More efficient selling means you’re getting more revenue from the same marketing and sales investment.
- Higher Customer Lifetime Value (CLV): If enablement helps reps close ideal customer profiles who are more likely to stay longer and expand their business, the long-term financial impact is even greater.
To truly demonstrate financial impact, regularly calculate the ROI of your sales enablement programs. Compare the cost of enablement initiatives (salaries, tools, content creation) against the incremental revenue generated by improved metrics like win rates, average deal size, and reduced sales cycle length.
Overcoming Challenges in Tracking Sales Enablement Metrics
Implementing a robust metrics tracking system isn’t without its challenges:
- Data Silos: Information often resides in different systems (CRM, LMS, content platforms). Integration is key.
- Inconsistent Data Entry: Poor CRM hygiene can lead to inaccurate metrics. Regular training and enforcement of data entry standards are essential.
- Attribution Complexity: It can be challenging to directly attribute a specific uplift in win rate solely to one enablement initiative. Focus on trends and correlations across multiple metrics.
- Resistance to Change: Sales teams might resist new tools or processes. Emphasize the benefits to them (easier selling, higher commissions) and provide thorough training and support.
To mitigate these challenges, start small, focus on a few key sales enablement metrics, and gradually expand your tracking capabilities. Invest in platforms that offer integrated analytics and reporting. Most importantly, foster a culture of data-driven decision-making within your sales organization.
The Path to a 30% Win Rate Boost by Q4 2026
Achieving a 30% increase in win rates by Q4 2026 is an ambitious yet entirely attainable goal with a strategic, data-driven approach to sales enablement. It requires:
- Commitment to Data: Acknowledging that sales enablement metrics are the compass guiding your strategy.
- Holistic Enablement: Addressing content, training, coaching, and technology as interconnected pillars.
- Continuous Optimization: Regularly analyzing data, identifying areas for improvement, and iterating on your programs.
- Cross-Functional Collaboration: Ensuring sales, marketing, and leadership are aligned on goals and strategies.
By diligently tracking and acting upon the sales enablement metrics discussed in this guide, your organization can create a powerful engine for sales growth. This isn’t just about hitting a number; it’s about transforming your sales operations into a highly efficient, effective, and predictable revenue-generating machine. The financial impact of such an achievement will be profound, setting your business on a trajectory of sustained success for years to come.
Conclusion
The journey to a 30% boost in win rates by Q4 2026 is paved with data. By meticulously focusing on key sales enablement metrics such as win rate, sales cycle length, content utilization, and training effectiveness, businesses can gain unparalleled insights into their sales performance. These insights, when acted upon strategically, allow for the continuous refinement of enablement programs, leading to more empowered sales teams, more satisfied customers, and ultimately, a healthier bottom line.
Don’t let your sales enablement efforts be a black box. Embrace the power of metrics to illuminate the path to success, justify your investments, and drive the kind of transformative growth that makes a significant financial impact. Start tracking, start analyzing, and start enabling your sales team to achieve unprecedented levels of success. The future of your revenue growth depends on it.